
Navigating Reports
Contents of this article
Why use reports?
Visualping's reporting tools can help you manage your workflow and enable a seamless sharing experience across your organization. Reports allow users to easily see many changes over a period of time, as well as manage those changes as a team through comments, flags and our hiding tool. Reports are also great if you have a lot of jobs, which create a lot of alerts. Instead of receiving all of those alerts as emails, you can instead receive 1 scheduled report by email. Check out how to mute alerts.
Note: a business plan is required to generate reports. Any users who are assigned to the report's workspace, regardless of permissions, can view the report.
Navigating reports
Accessing the report
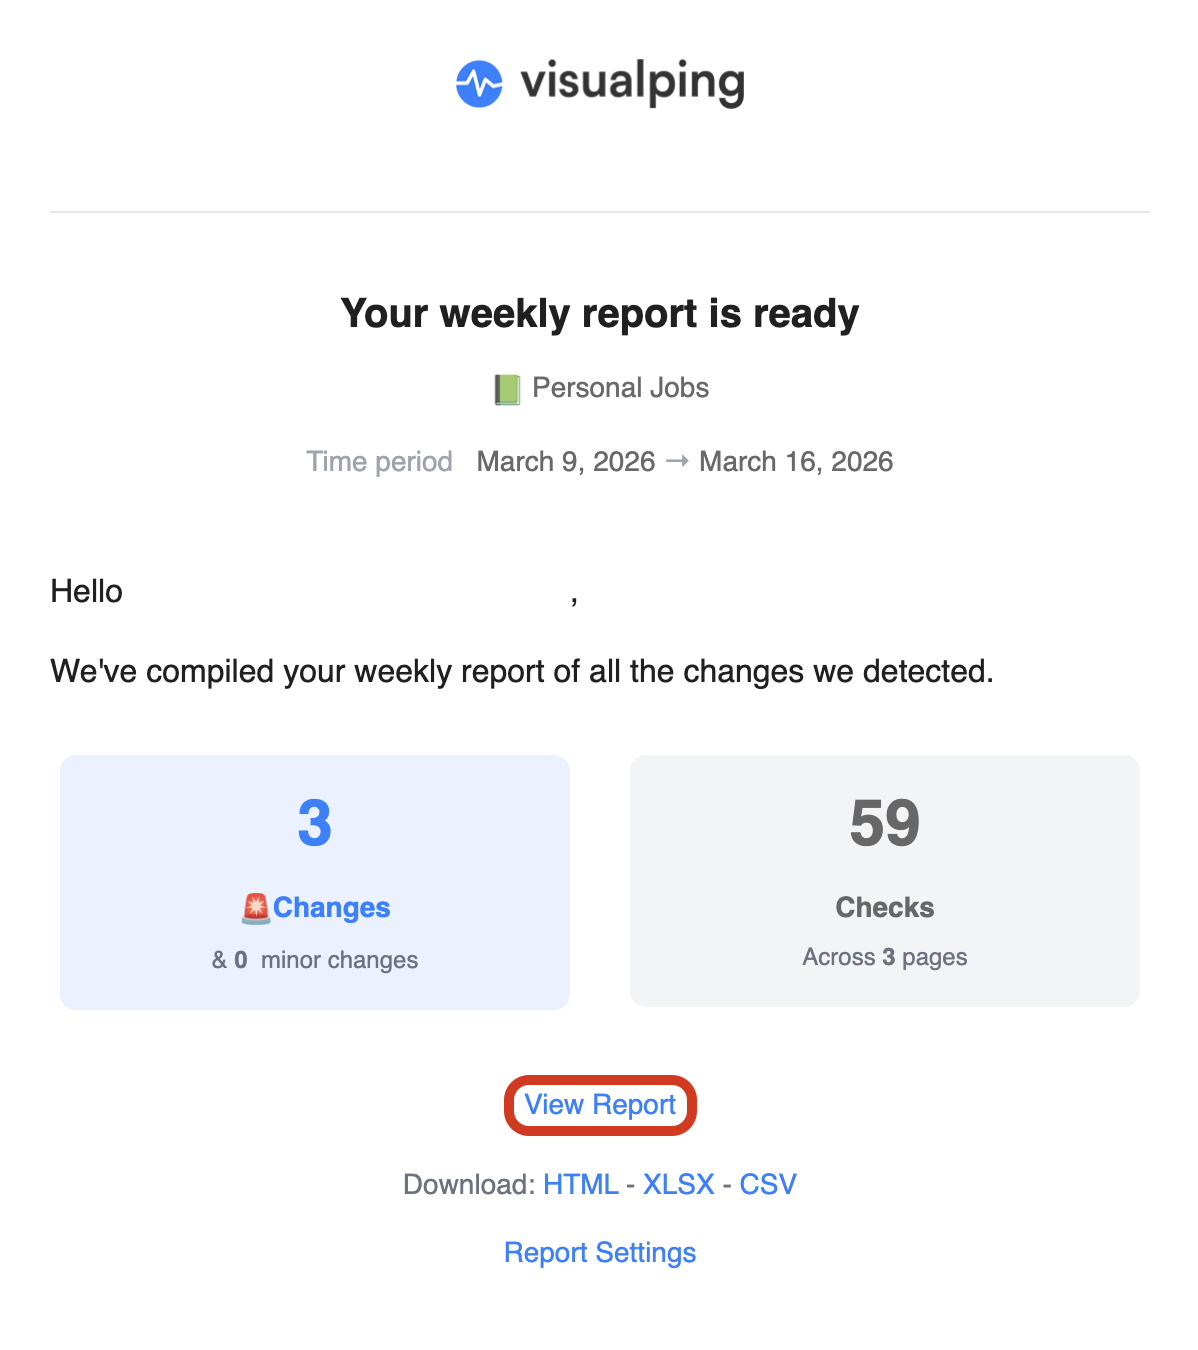
Once the report has been created, you can access the report by clicking on View.

When you receive a scheduled report email, click View Report to open the report, or Edit Report to adjust its settings directly. The email subject follows the format: "Your [weekly/daily/monthly] report is ready."
Exporting reports
Do you want to easily save this report or share it with your coworkers? Then you can export the report.
The report can be exported through the Generate Report view, by clicking on the download button next to the report.

Or by clicking on the download icon directly from the web report.

Or, finally, by downloading it straight from the scheduled email. In the email, the download link for the HTML report is labeled WEB.

We have 4 file options:
CSV
Excel
HTML (labeled WEB in scheduled report emails; a visual card-based representation of the changes)
PDF (only available from the web report)
Report Summary & Analysis
If you had enabled Report Summary & Analysis during the report creation, you will find the AI crafted summary at the top of the report. Depending on your prompt, this section will summarize important changes for certain jobs, highlight trends in certain changes, or more based on the prompt you provided to our AI analyzer.
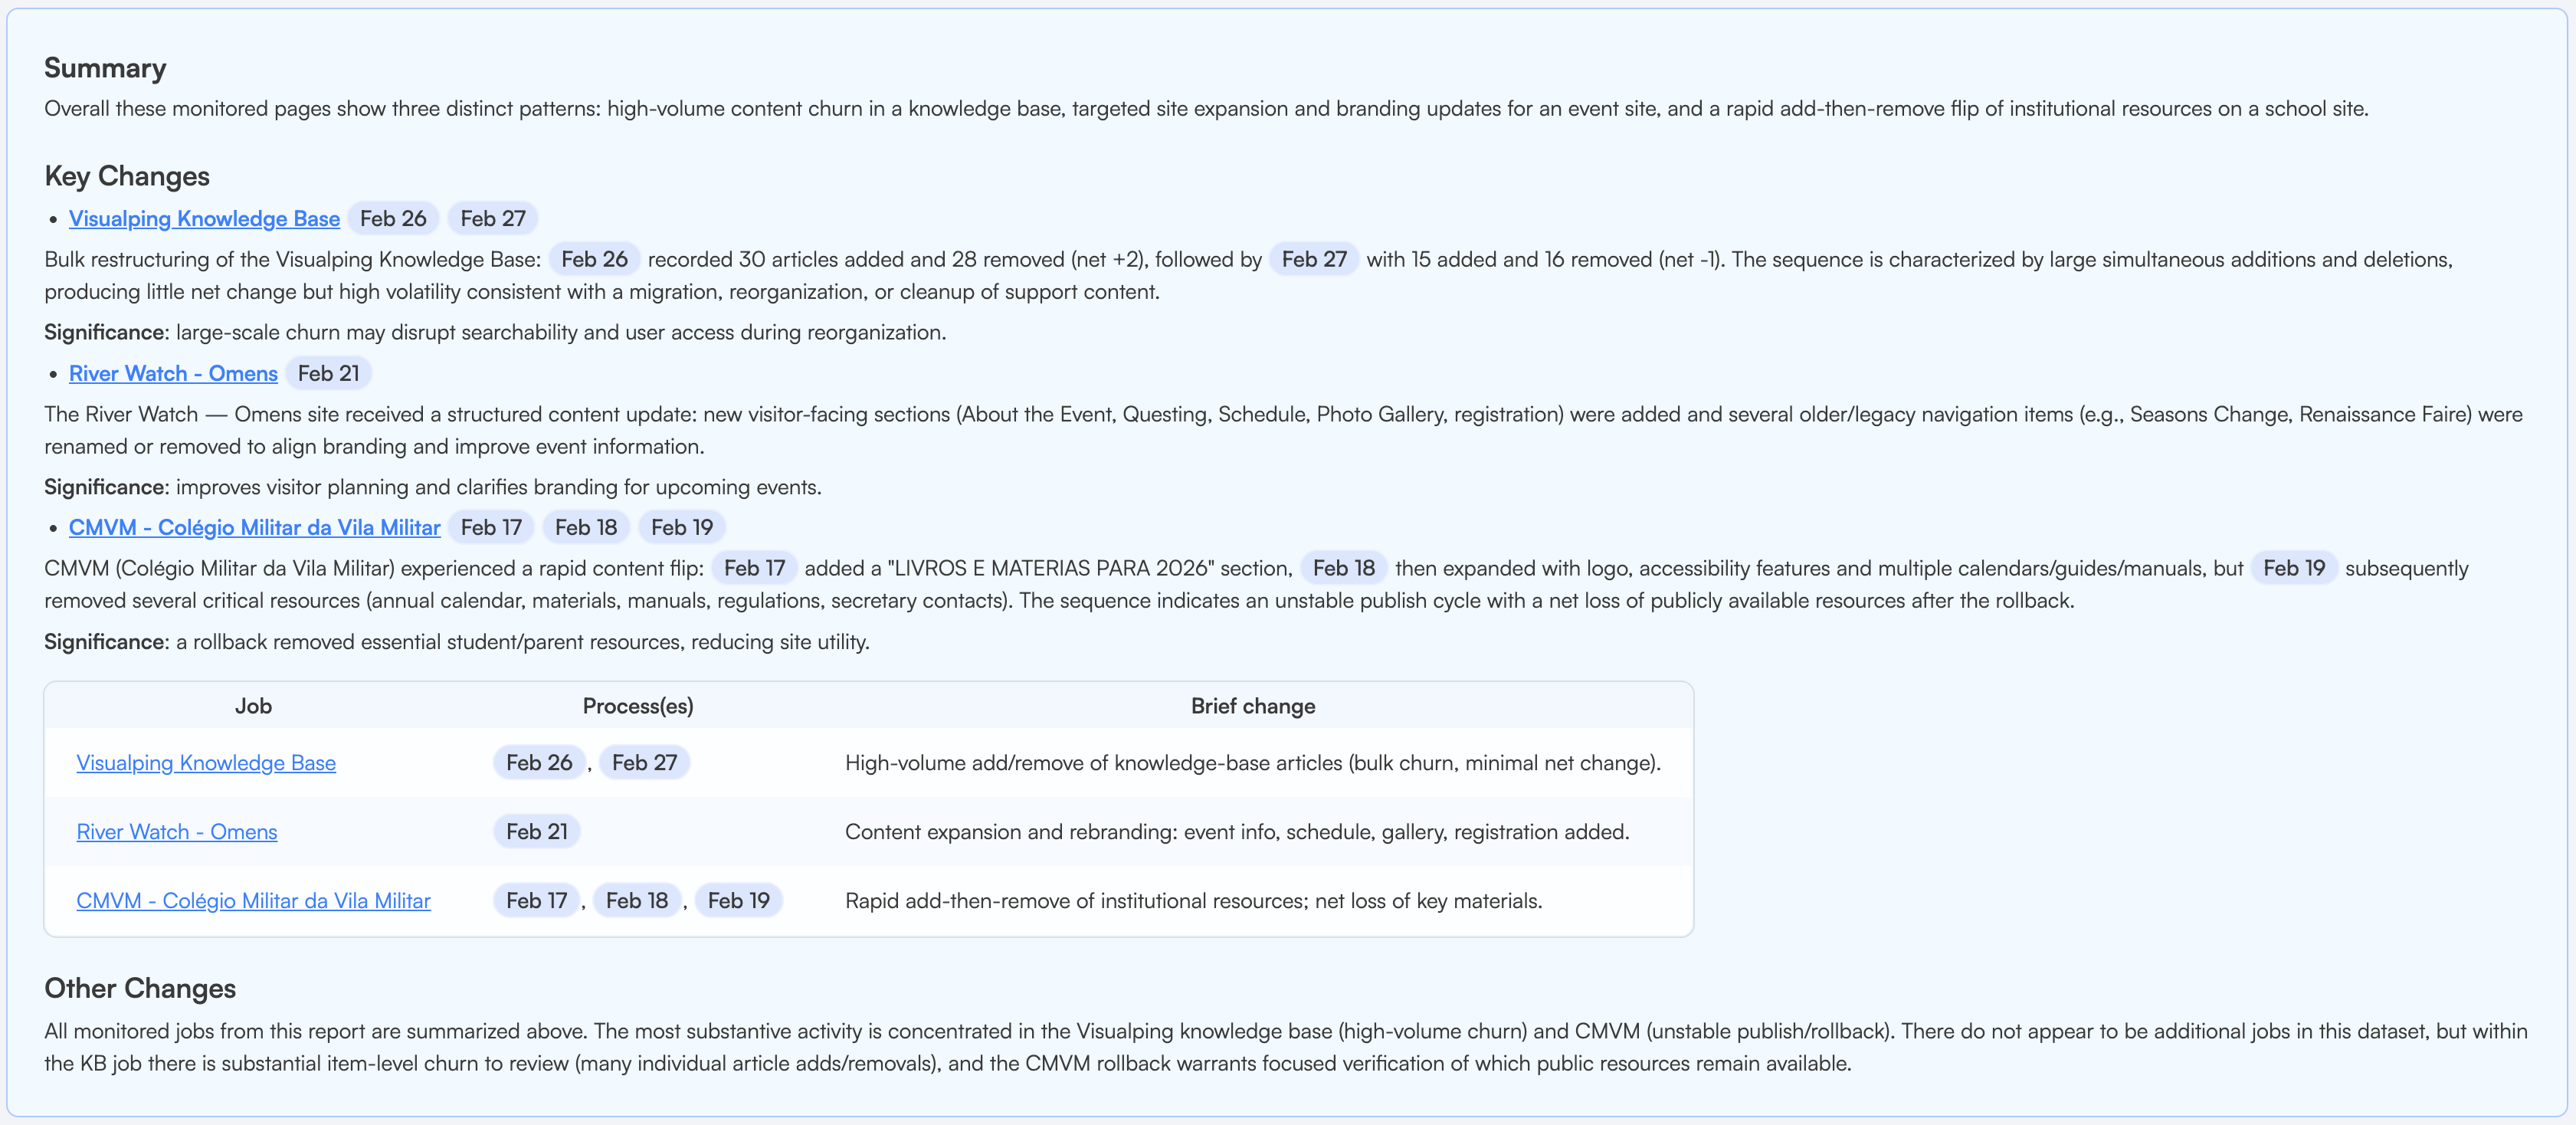
Note that even if you didn't have it enabled when creating the report, want to change the prompt, or regenerate to incorporate flagged or hidden entries, you can always generate a new summary with your desired prompt. Simply click on Edit next to the Custom Prompt tab to change the prompt, then select Generate to create the new summary.

Viewing the changes
Under the summary, you will find a list of changes which happened during the timeframe of the report.
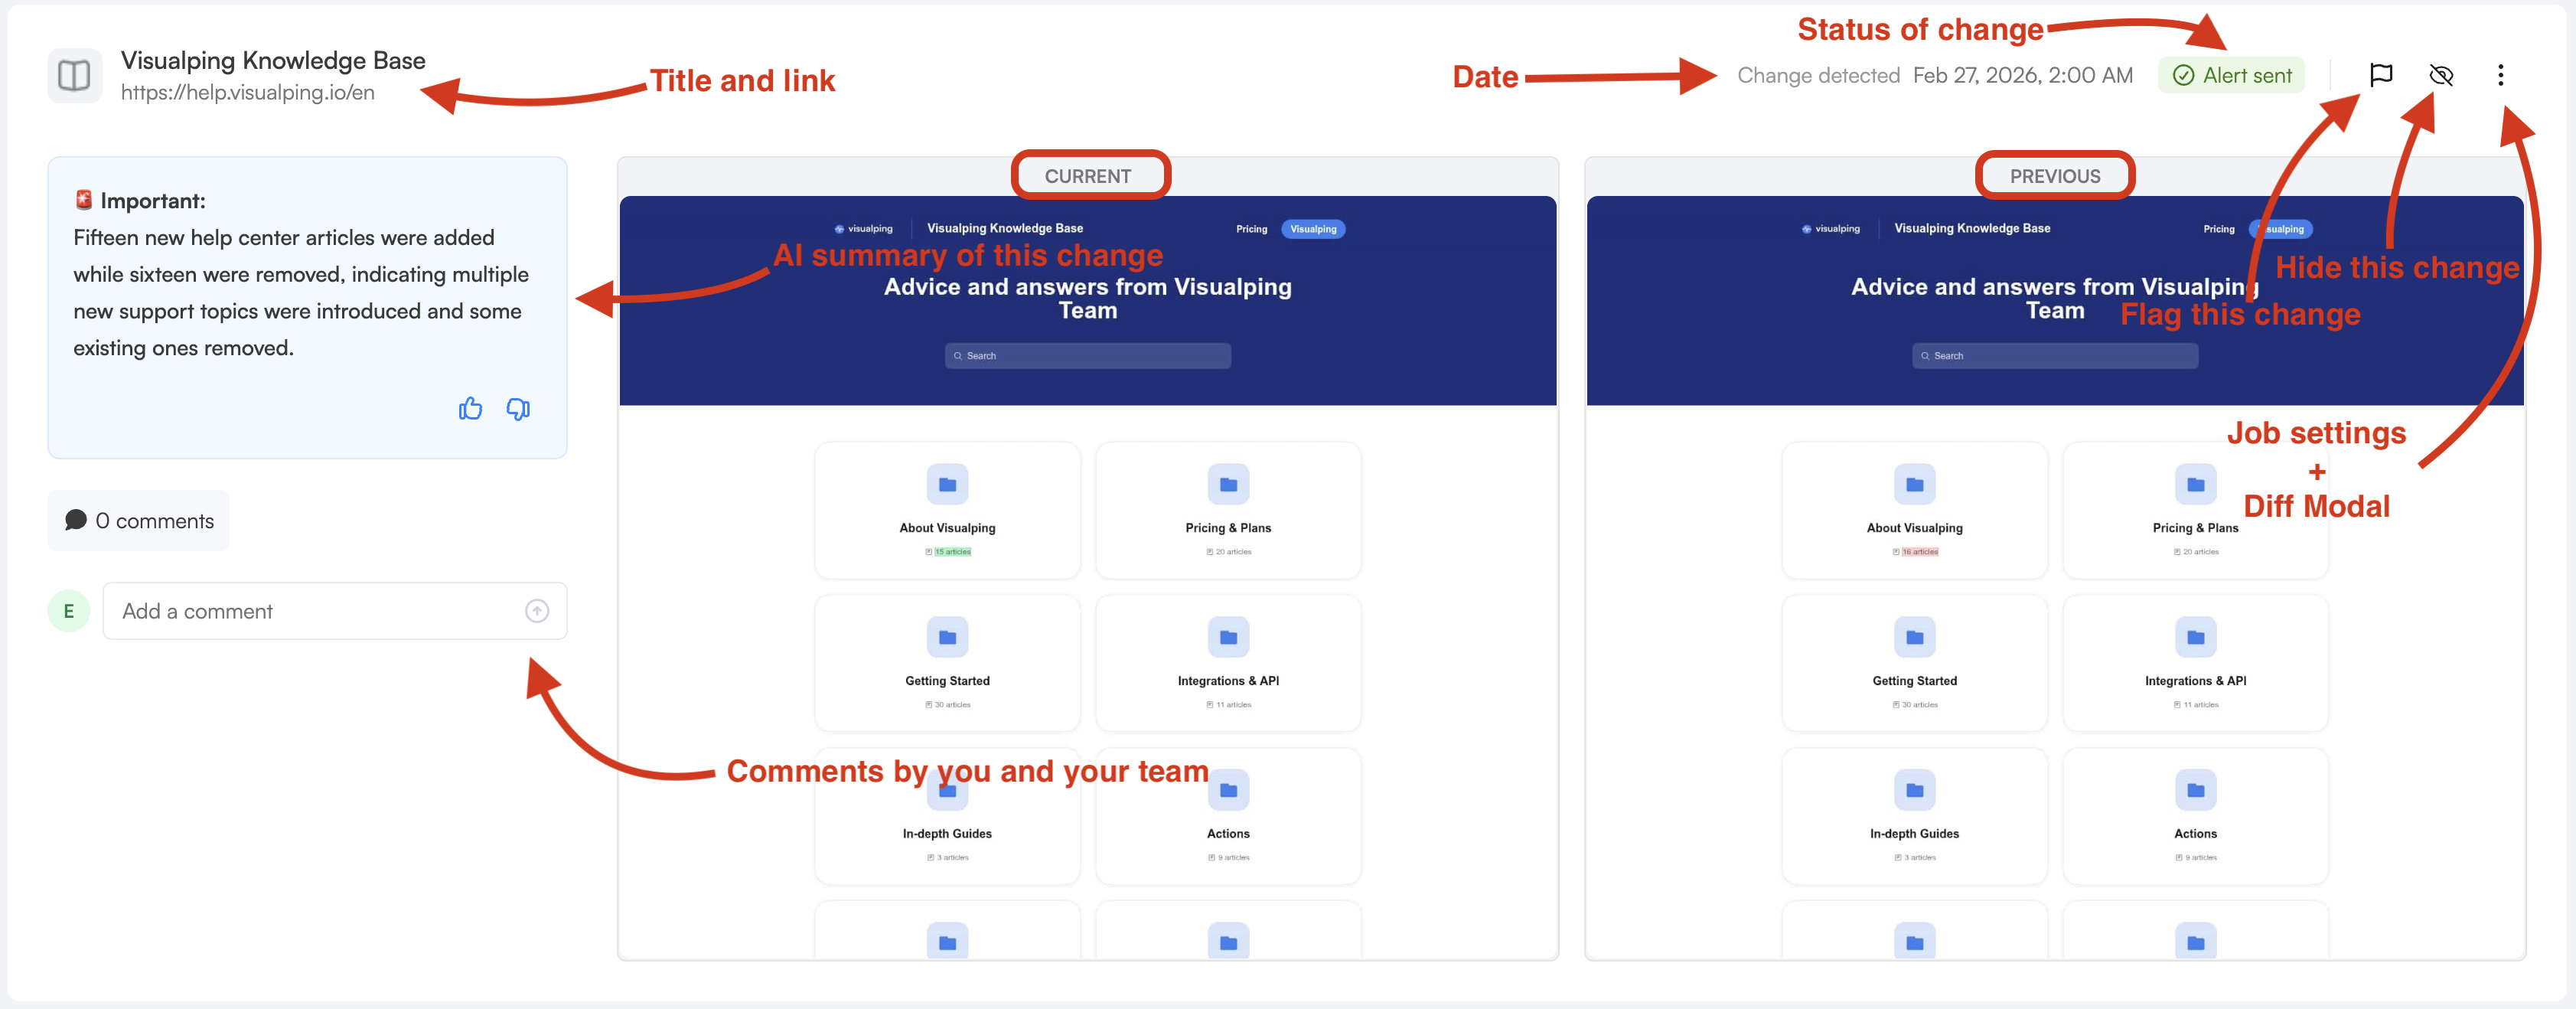
By default, the changes include a screenshot of the page before and after the change, labeled Previous and Current.
To the left of the screenshots, you will find the AI summary of the change, along with thumb up and down buttons to give feedback on the accuracy of the alert.
Underneath the AI summary, you and your team can add shared comments to the change.
To the top-right of the screenshots, you also have the option to flag changes that need follow-up. Hide the change to remove noise from the active view. Hidden changes stay in the report data but stop cluttering the workspace.
Click on the More Options icon (the 3 vertical dots) to open the job settings or the diff modal, to view the change in more details.
Report options
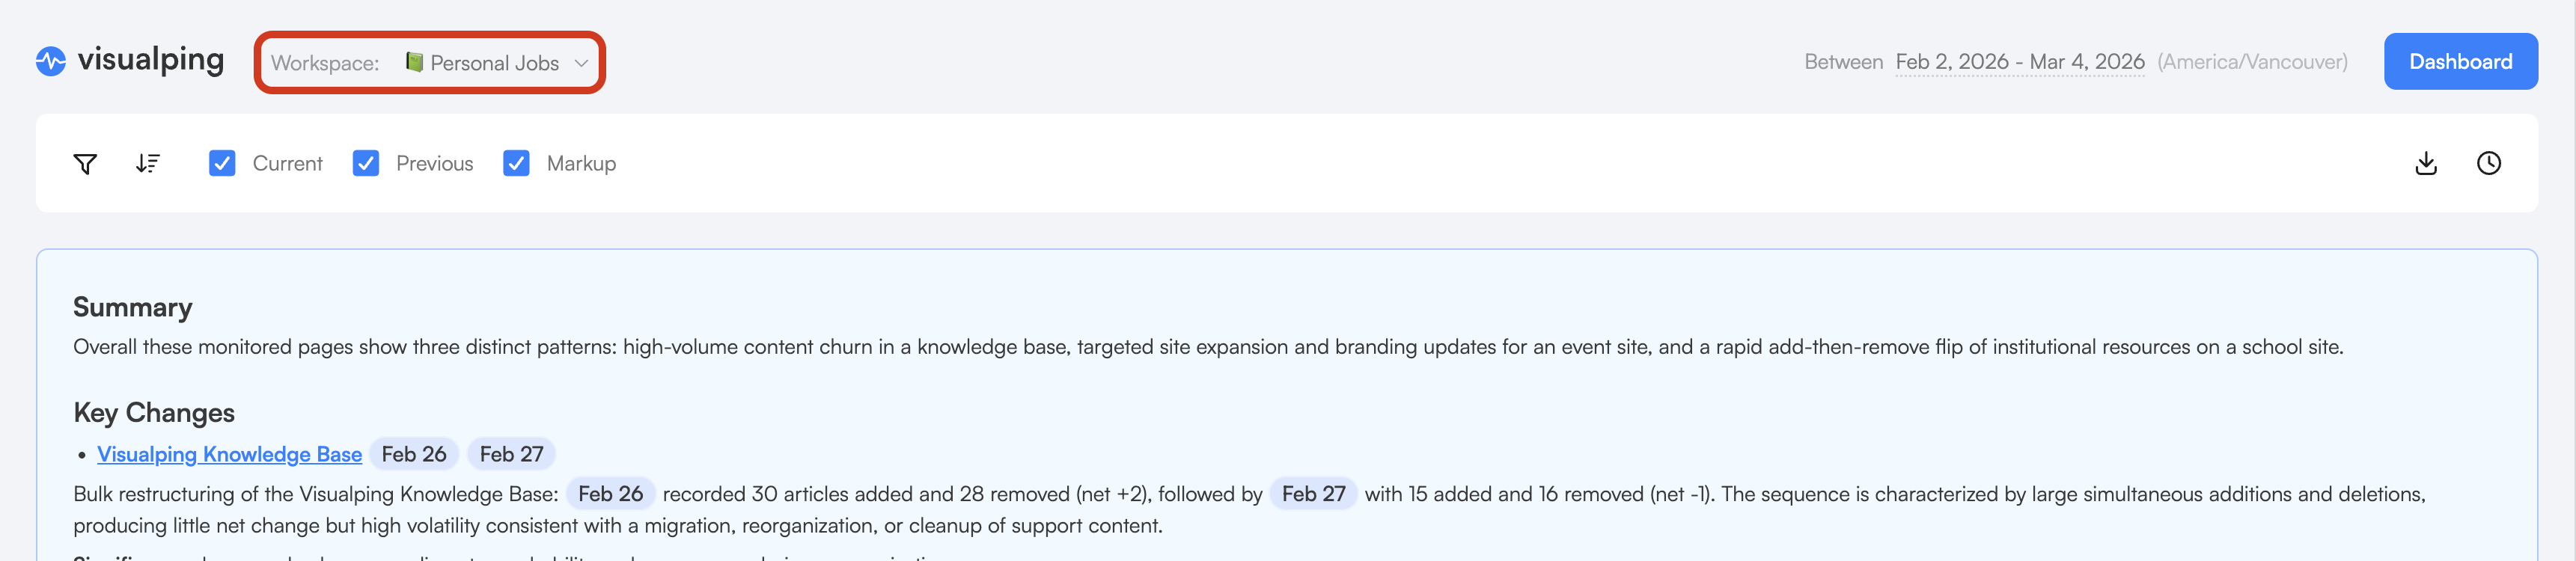
At the top of the report are a few options that change the way the report is displayed. Those options are the same as the ones which were selected during report creation, and can be updated in real time depending on your needs.

Determine what kind of options you want your reports to contain:
Current and Previous: snapshots of the website after (current) and before (previous) the change. You can choose which one(s) you want to display.
Markup: whether to add the green or red highlighting which indicates changes on the screenshots.
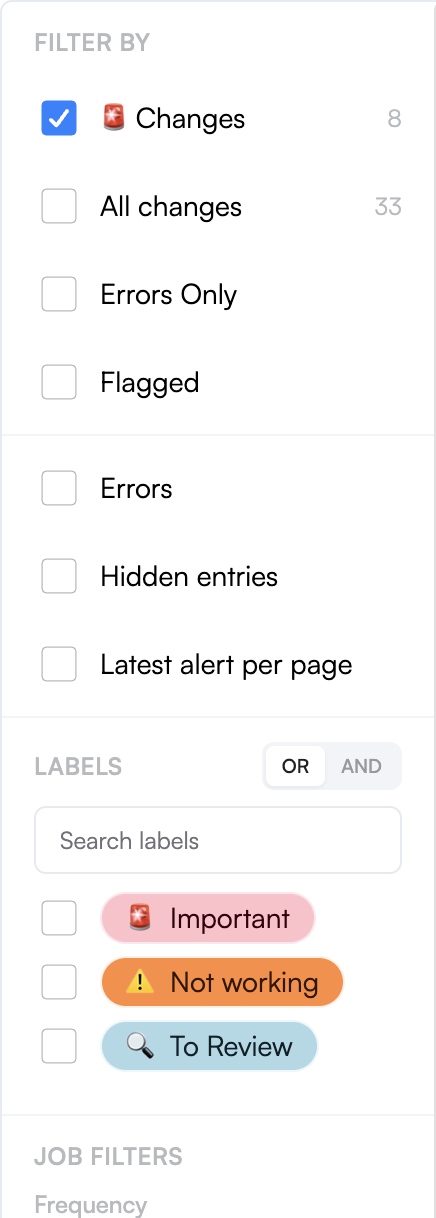
You can choose to filter the changes using a few options. The filter dropdown header displays the total number of monitoring entries covered by the current filter selection, so you can gauge report coverage at a glance.
Important Changes: includes only changes that trigger alerts.
All Changes: includes any changes above the n% threshold.
Errors Only: returns exclusively error entries, making it easier to focus on jobs that need attention.
Flagged: will only show changes that were flagged previously.
Then you can decide whether the report should include Errors. This feature is most useful if you are trying to test certain jobs or URLs.
You can choose whether to show Hidden entries which you had tagged previously.
If only the latest change of each page is important to you, you can activate Latest alert per page to avoid the noise created by a series of changes on the same site.
Additionally you can choose to display changes with a certain label. Pick and choose which labels you want included. When multiple labels are selected, use the AND/OR toggle to control matching logic:
OR (default): includes jobs that have at least one of the selected labels.
AND: includes only jobs that have all of the selected labels. Use this for more precise filtering when jobs carry multiple labels.
The total number of monitoring entries matching the current filter is also shown in the report footer for quick reference.
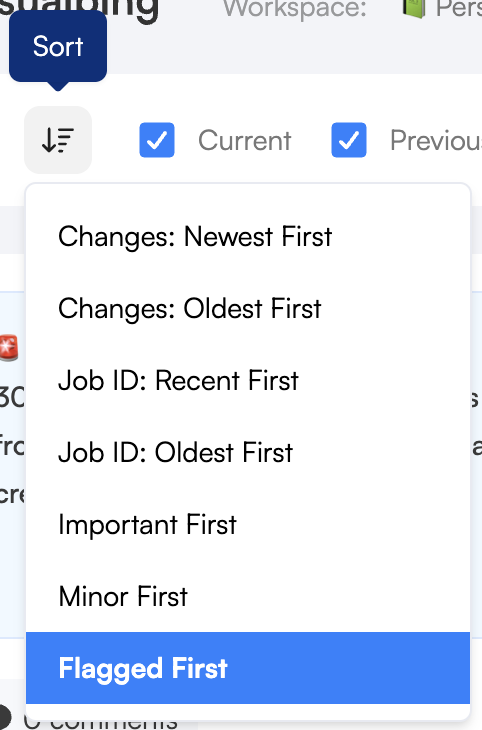
Finally, you can choose how the changes should be ordered:
Newest First
Oldest First
Job ID: Recent First groups changes by job and organizes them recent first within a job
Job ID: Oldest First groups changes by job and organizes them oldest first within a job
Important First places the changes tagged important first and organizes them newest first within each importance category
Minor First places the changes not tagged important first and organizes them newest first within each importance category
Flagged First places flagged jobs first and organizes them newest first within each group
Adjusting content shown
You can get the changes from a different workspace by selecting it under the Workspace dropdown.
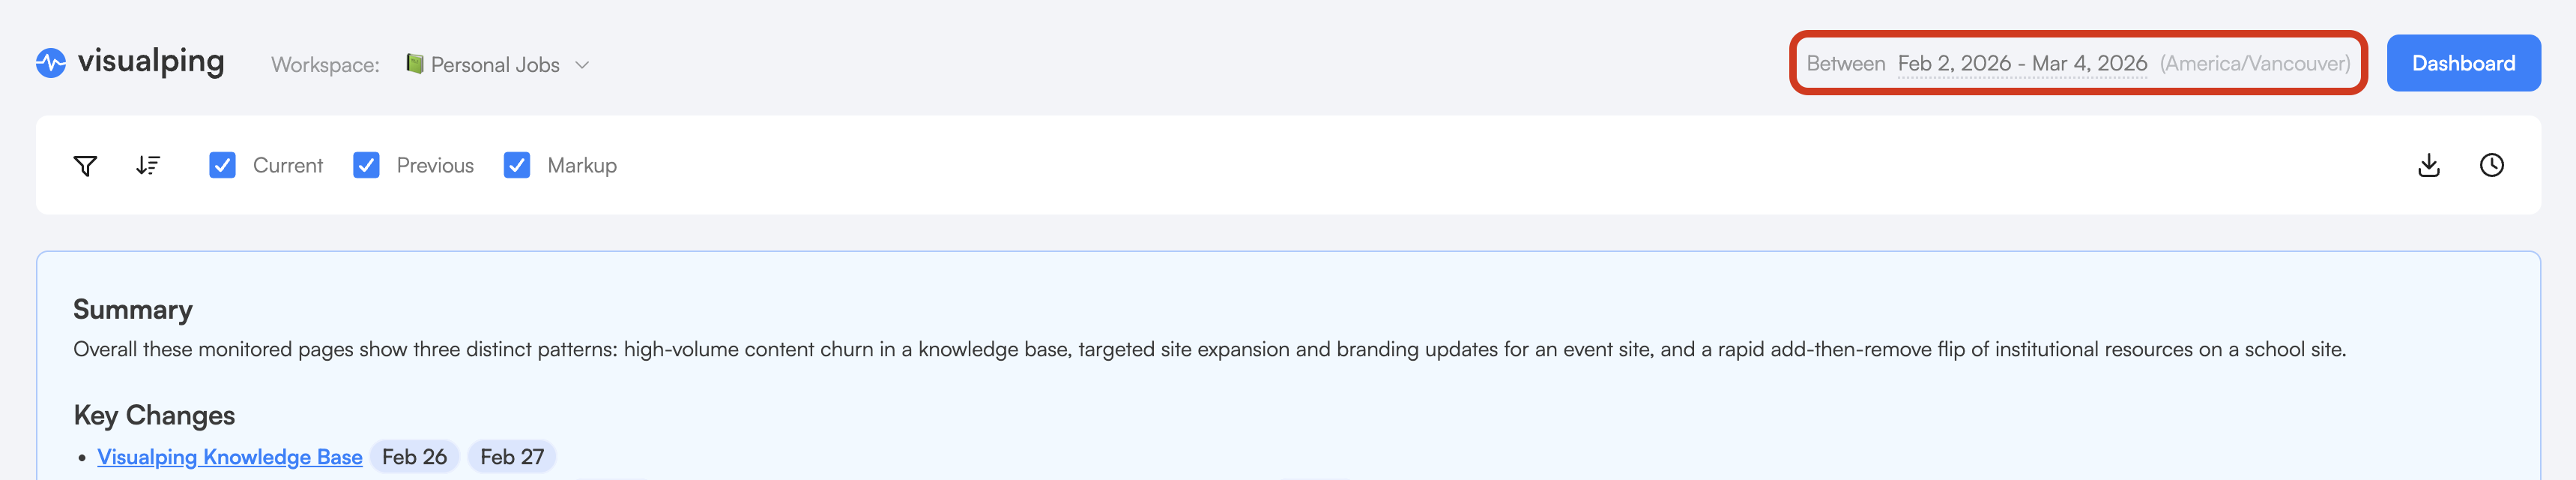
The time range can be adjusted on the fly, by selecting new dates besides the Dashboard button.
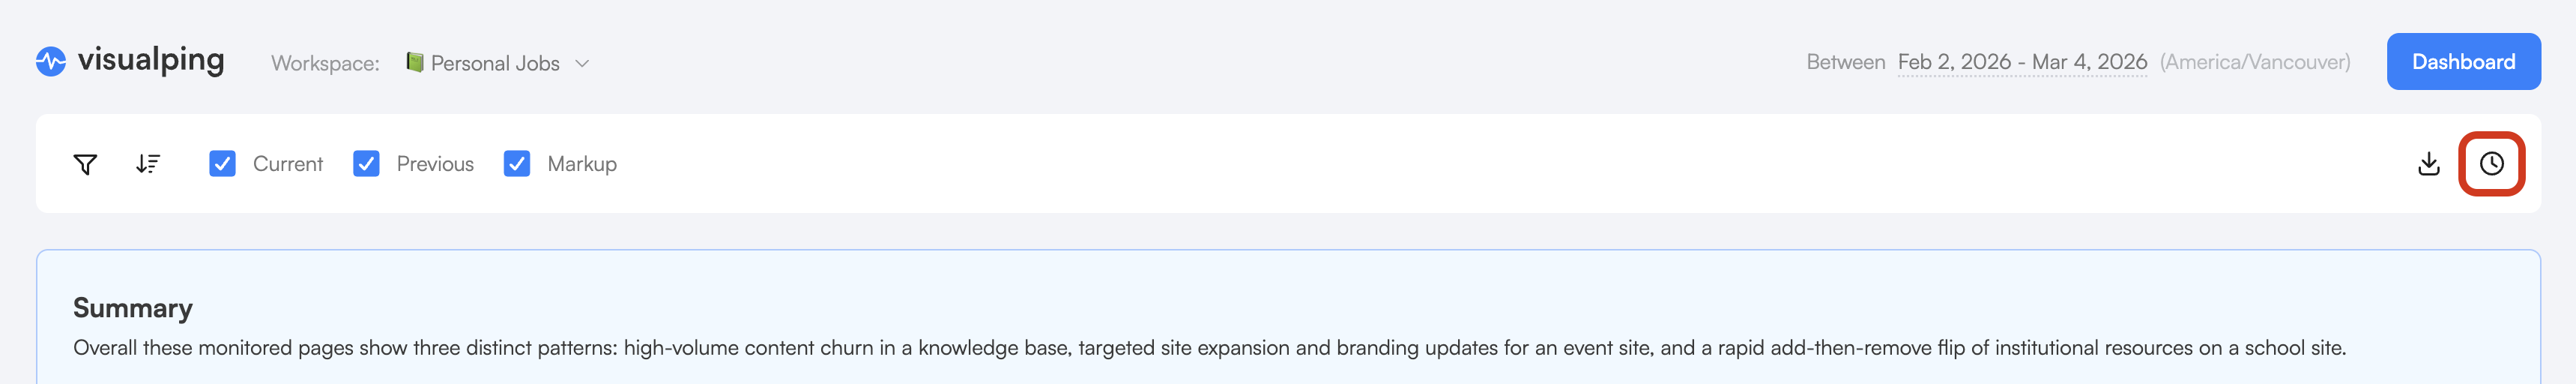
To browse past reports, click the History tab in the report panel. Past reports are displayed in a card-based layout. Use the search bar at the top of the History tab to find a specific report by name or date. Click View on any card to open that report.
Frequently Asked Questions
Report generates but shows no changes
No changes were detected for the selected jobs in your date range. Try these fixes:
Expand the date range.
Confirm the selected jobs are active (not paused).
Switch from Important Changes to All Changes — the AI filter may have classified changes as routine.
Scheduled reports are not arriving
Check that the scheduled time and timezone match your expectations — a report set to 9:00 AM Pacific won't arrive at 9:00 AM Eastern.
Confirm you are a member of the workspace. Scheduled reports are delivered to workspace members only.
Check your spam or promotions folder.
PDF export is blank or incomplete
Try a shorter date range. Reports covering many months with hundreds of changes can exceed PDF rendering limits.
Export as Excel or CSV instead for large datasets.
Report does not include a specific job's changes
Confirm the job was selected (checked) when you generated the report.
Verify the job had detected changes within the date range you set.
I'm having issues, what can I do?
If none of the troubleshooting steps above resolve the problem, or if you are running into technical issues, reach out to our Support team. Include a screenshot, what you were trying to do, and any error messages so we can help faster.