
Creating Visualping Reports
Contents of this article
Why use reports?
How to generate a report
Setting up scheduled reports
FAQ
Why use reports?
Reports is a very useful feature only available to users on Visualping for Business plans. If you have questions about a plan, please reach out to us.
Visualping's reports can help you manage your workflow and enable a seamless sharing experience across your organization. Whether you need to generate reports for your coworkers or want to completely eliminate email notifications, our reporting tools are your one-stop shop.
How to generate a report
Step 1:
Select monitors to include
Use the checkboxes next to each monitor to select the ones you want in the report. By default, if no monitors are selected, a report will include all active and inactive monitors within the current workspace unless further filtered out using the options found on Step 4.
Step 2:
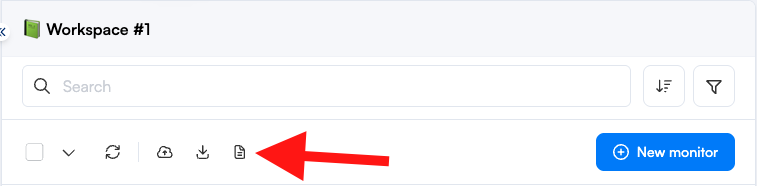
Click on the report button found on the Visualping dashboard.
Step 3:
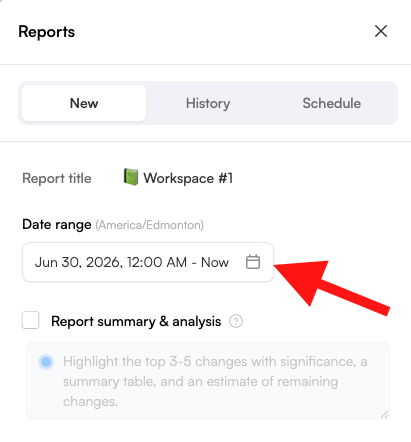
Select a range of dates you want to filter for.
You can also choose from the preset date ranges and customize the start and end times.
Step 4:
Set up report settings
Enable Report Summary & Analysis to receive a handy summary of all the changes present in the report. Once enabled, you will see a prompt appear, which lets the AI know how to construct the summary. While the feature works well with the default prompt for a high-level overview, we recommend adding your own to truly tailor the output to your needs. To generate a strong prompt, we highly suggest checking out this article on how to create a strong prompt suited for your needs: Creating a Strong Prompt.
Note: For reports covering very large check sets, the Report Summary & Analysis will automatically generate a high-level "summary of summaries" — a rolled-up overview of all monitor-level summaries. This includes information from hidden entries, flagged items, comments, and extracted data, and is especially useful when monitoring hundreds of monitors at once. The summary also appears in the scheduled report email.
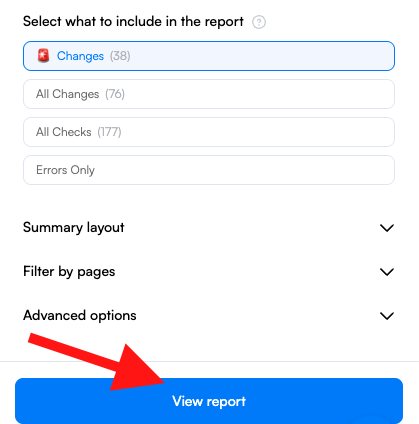
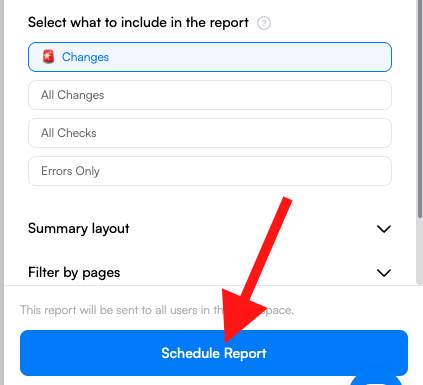
Determine what kind of changes you want your reports to contain:
🚨 Changes: includes only changes that trigger alerts.
All Changes: any changes that may occur including ones that did not trigger a notification.
All Checks: includes all of the above and will include checks that have no change detected
Errors Only: will only contain checks that have produced errors
This is good for maintaining your jobs making sure that the URLs are reachable
Choose what to include in the summary layout:
Current and Previous: snapshots of the website after (current) and before (previous) the change.
Markup: various important information related to the check, such as monitor title, link to the monitor settings, date and time of check, monitor id, URL, and change summary.
Choose how to filter specific checks:
Labels: add specific labels to the filter by checking off the checkboxes next to the label.
We also offer options to switch between OR/AND mode so if you would like to filter based on a specific tag combination, we would suggest using the AND mode
Page Status: filter based on whether the job is active, inactive, or all jobs
Frequency: filter based on 1 or more check frequencies
Schedule Type: filter based on whether a job has a custom schedule set
You can also decide whether the report should include errors. This feature is most useful if you are trying to test certain monitors or URLs.
If only the latest change of a page is important to you, you can activate Only show the most recent alert for each page monitored.
Step 5:
Click View Report.
Step 6:
Your report is ready!
For a one time report, you will find your newly-created report at the bottom of the options.
You can also find all previously created reports in the History tab. Reports are displayed in a card-based layout — use the search bar to find a specific report by name or date.
Setting up scheduled reports
Some of our customers don't want to receive constant alerts in their inboxes. Instead, they receive weekly or monthly reports. Others prefer both. It largely depends on whether you need notifications in real-time. Whatever the case may be, let's walk through enabling scheduled reporting.
Step 1:
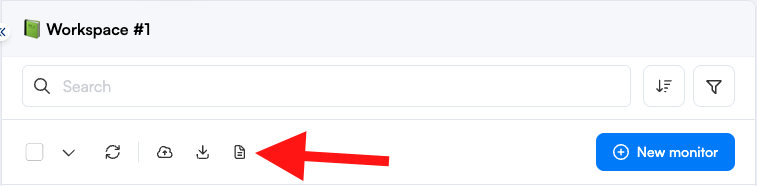
Click on the report button found on the Visualping dashboard.
Step 2:
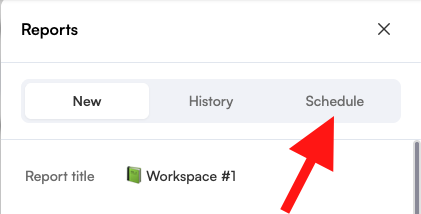
Select schedule
Scheduled reports are sent to you every day, week or month at a given time of day, based on the timezone specified in your settings. Each report will include changes since the last report.
Step 3:
Click on Add scheduled report
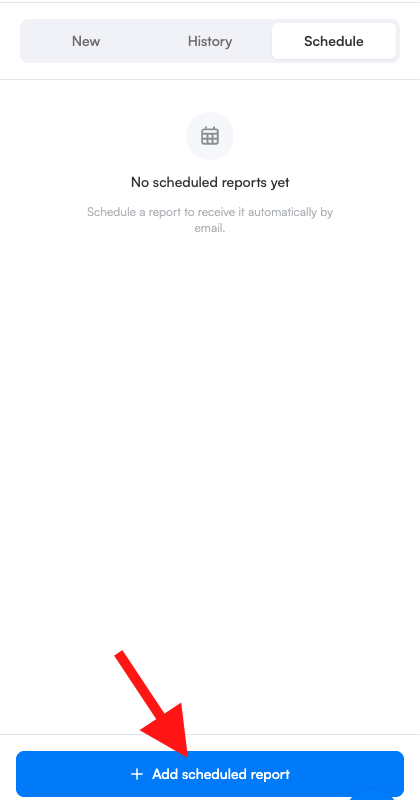
Note: We allow up to 10 scheduled reports per workspace. Each report can have it's own schedule, settings, and filters.
Step 4:
Set up report settings
Enable Report Summary & Analysis to receive a handy summary of all the changes present in the report. Once enabled, you will see a prompt appear, which lets the AI know how to construct the summary. While the feature works well with the default prompt for a high-level overview, we recommend adding your own to truly tailor the output to your needs. To generate a strong prompt, we highly suggest checking out this article on how to create a strong prompt suited for your needs: Creating a Strong Prompt.
Note: For reports covering very large check sets, the Report Summary & Analysis will automatically generate a high-level "summary of summaries" — a rolled-up overview of all monitor-level summaries. This includes information from hidden entries, flagged items, comments, and extracted data, and is especially useful when monitoring hundreds of monitors at once. The summary also appears in the scheduled report email.
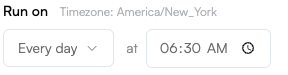
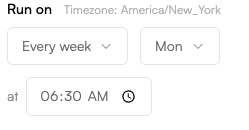
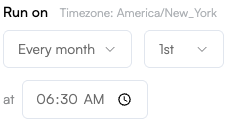
Determine when you would like to run and send the report:
Every day: select the time for when you would like to run and send the report
Every week: select the day and the time for when you would like to run and send the report
Every month: select the date and time for when you would like to run and send the report
Determine what kind of changes you want your reports to contain:
🚨 Changes: includes only changes that trigger alerts.
All Changes: any changes that may occur including ones that did not trigger a notification.
All Checks: includes all of the above and will include checks that have no change detected
Errors Only: will only contain checks that have produced errors
This is good for maintaining your jobs making sure that the URLs are reachable
Choose what to include in the summary layout:
Current and Previous: snapshots of the website after (current) and before (previous) the change.
Markup: various important information related to the check, such as monitor title, link to the monitor settings, date and time of check, monitor id, URL, and change summary.
Choose how to filter specific checks:
Labels: add specific labels to the filter by checking off the checkboxes next to the label.
We also offer options to switch between OR/AND mode so if you would like to filter based on a specific tag combination, we would suggest using the AND mode
Page Status: filter based on whether the job is active, inactive, or all jobs
Frequency: filter based on 1 or more check frequencies
Schedule Type: filter based on whether a job has a custom schedule set
You can also decide whether the report should include errors. This feature is most useful if you are trying to test certain monitors or URLs.
If only the latest change of a page is important to you, you can activate Only show the most recent alert for each page monitored.
Step 5:
Click Schedule Report.
Step 6:
Receive your reports by email
Scheduled reports are emailed to all users of the workspace each time a report is generated. The email includes a View Report button to open the report and an Edit Report button to adjust settings. Download links in the email use friendly labels — the previously HTML export is labeled WEB.
You can also find all previously created reports in the History tab. Reports are displayed in a card-based layout — use the search bar to find a specific report by name or date.
Frequently Asked Questions
Report generates but shows no changes
No changes were detected for the selected monitors in your date range. Try these fixes:
Expand the date range.
Confirm the selected monitors are active (not paused).
Switch from Important Changes to All Changes — the AI filter may have classified changes as routine.
Scheduled reports are not arriving
Check that the scheduled time and timezone match your expectations — a report set to 9:00 AM Pacific won't arrive at 9:00 AM Eastern.
Confirm you are a member of the workspace. Scheduled reports are delivered to workspace members only.
Check your spam or promotions folder.
PDF export is blank or incomplete
Try a shorter date range. Reports covering many months with hundreds of changes can exceed PDF rendering limits.
Export as Excel or CSV instead for large datasets.
Report does not include a specific monitor's changes
Confirm the monitor was selected (checked) when you generated the report.
Verify the monitor had detected changes within the date range you set.
I'm having issues, what can I do?
If none of the troubleshooting steps above resolve the problem, or if you are running into technical issues, reach out to our Support team at support@visualping.io. Include a screenshot, what you were trying to do, and any error messages so we can help faster.
Related articles
Navigating reports
Reducing false positives