
Using the Health page
Contents of this article
What is the Health page?
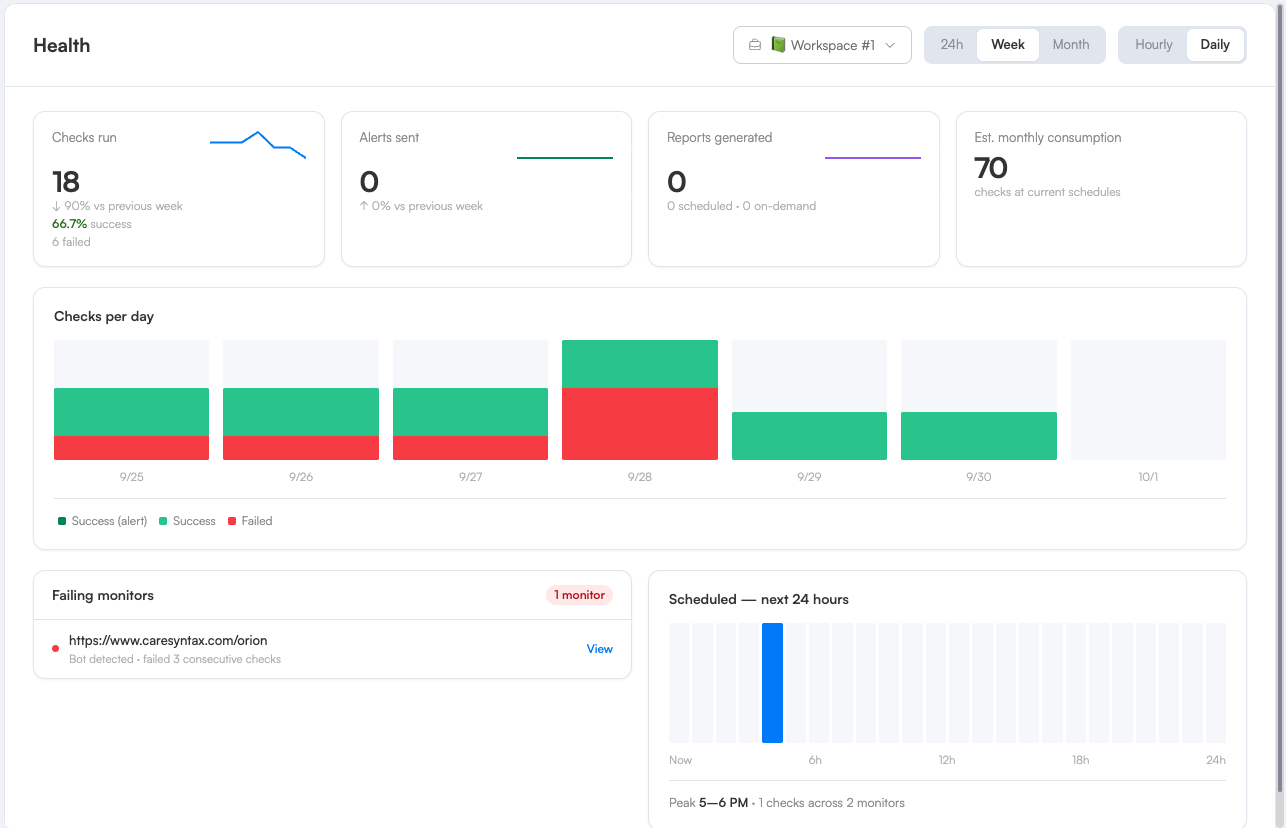
The Health page shows how your monitors have been running: how many checks ran, how many failed, how many alerts were produced, which monitors are currently failing, and when your next checks are due.
It's a read-only overview. Nothing on the Health page changes, pauses, or retries your monitors. To act on a monitor, open it from the page or from your dashboard.
Note: The Health page is available on all plans, including Free, to every user who can view monitors.
Opening the Health page
You can open the Health page in two ways:
From the Settings menu in the dashboard header, select Health.
From your account settings, select Health in the sidebar (between Billing and Workspaces).
Business accounts: The page shows one workspace at a time. Use the workspace picker at the top of the page to switch between workspaces. There is no combined total across all workspaces.
Choosing a time range
Use the range buttons at the top of the page to choose 24h, Week, or Month. The page opens on Week by default.
Range | Chart grouping | Default |
24h | Hourly | Hourly |
Week | Daily or Hourly | Daily |
Month | Daily | Daily |
A few things to keep in mind:
Ranges are rolling. "Week" means the last 7 days up to now, not Monday to Sunday. The last bar is still filling up, so it's usually shorter than the others.
Times use your workspace's time zone, not your computer's. On days when clocks change for daylight saving, the hourly view shows 23 or 25 bars.
Numbers refresh about once a minute, so a check that just finished may take a moment to appear.
Summary cards
The four cards at the top give a quick summary of the selected range. The first three compare the current range with the period just before it (for example, this week against last week).
Card | What it shows |
Checks run | The number of checks in the range, the percentage that succeeded, and how many failed. |
Alerts sent | The number of checks that found an alert-worthy change. |
Reports generated | The number of reports created, split into scheduled and on-demand. |
Est. monthly consumption | An estimate of how many checks your current monitors will use in a month, compared with your plan's allowance. This card is based on your current schedules and doesn't change with the time range. |
How "Checks run" is counted
"Checks run" counts scheduled checks, checks you run manually, and the first check when a monitor is created. It doesn't count some automatic re-checks Visualping runs behind the scenes, such as after certain settings changes. Because of this, it may not match the check usage shown on your billing page exactly.
How "Alerts sent" is counted
"Alerts sent" counts checks that found an important or regular change, the same changes the Reports page shows by default. Minor changes aren't counted. It counts alert-worthy changes, not delivered notifications, so it can be higher than the number of emails you received, for example if a monitor has email notifications turned off.
Checks chart
The chart shows your checks over the selected range, one bar per day or hour. Each bar is split into three parts:
Success (alert): The check succeeded and found an alert-worthy change.
Success: The check succeeded with no alert-worthy change.
Failed: The check ran into an error.
You can interact with the chart:
Click a bar to see the monitors that had errors during that period. The panel below the chart switches to show them. Click the same bar again, or click Clear, to go back.
Click a legend item to show only that part of the bars. The chart rescales to fit, so its shape will change. Click it again to show everything.
Failing monitors
This panel lists active monitors that are failing right now. A monitor appears here once it has failed enough checks in a row to reach its default error alert threshold. As soon as it has one successful check, it drops off the list.
Each row shows the error and how many checks in a row have failed.
Monitors are sorted by how long they've been down, longest first.
The panel shows up to 6 monitors. The count badge shows the total number of failing monitors.
This panel always shows the current state, so it doesn't change when you switch the time range.
To manage failing monitors:
Click View to open a monitor and review or fix its settings.
Click View all to open your dashboard with the Failing only filter turned on. From there, you can select several monitors and act on them together. See Finding failing monitors.
Tip: A monitor that failed once and then recovered won't appear in this panel. To find it, click that period's bar in the checks chart.
Scheduled: next 24 hours
This chart shows how many monitors are due to be checked in each of the next 24 hours, starting from now. The busiest hours are shown in darker blue, and the line below the chart shows your peak hour and the total number of checks coming up.
The total can be higher than the bars add up to, because it also includes monitors that are overdue for a check.
Frequently Asked Questions
Does the Health page give my monitors a health score?
No. There is no health score or rating. The page shows counts, a success percentage, and the list of monitors that are currently failing.
Why don't the numbers match my billing page?
"Checks run" leaves out some automatic re-checks that Visualping runs behind the scenes, so it can be lower than your billing usage. If your workspace uses Full Website Import, its crawls are included in "Checks run" but don't use credits, so the number can also be higher. If the difference still looks wrong, contact our Support team.
Why does "View all" show more monitors than the panel?
The Failing monitors panel only counts active monitors. The Failing only filter on your dashboard also includes paused monitors that were failing when they were paused.
Can I see all my workspaces at once?
Not yet. On Business accounts, the Health page shows one workspace at a time. Use the workspace picker to switch between them.
I'm having issues, what can I do?
If something on the Health page doesn't look right, reach out to our Support team at support@visualping.io. Include the workspace name, the time range you selected, and a screenshot so we can help faster.